Cloudy with a Chance of Pain
engaging citizen scientists to connect joint pain with weather conditions
Cloudy with a Chance of Pain is part of a research study led by rheumatologist Dr. Will Dixon of the University of Manchester, with a goal of determining a possible causative link between weather and arthritis symptoms.
For millennia, people have believed that changes in weather had an impact on their chronic pain symptoms. The link between weather and pain was never scientifically proven, because of the lack of reliable data. So what better idea than conducting a nationwide citizen science effort in the UK where it rains all year round? With the help of uMotif, a design studio specialized in quantified self apps, the project’s scientific team came up with a study inviting thousands of patients to take part in the collection effort.
Each day, participants of the study log their symptoms into the application designed by uMotif. A symptom report includes 10 different metrics such as pain level, fatigue, stiffness, and overall well-being. The app also collects geolocation data from the device’s GPS so that each symptom report is matched with a location and a weather record. OCR’s job was to visualize that information, and analyze whether or not there’s a link between weather and pain.
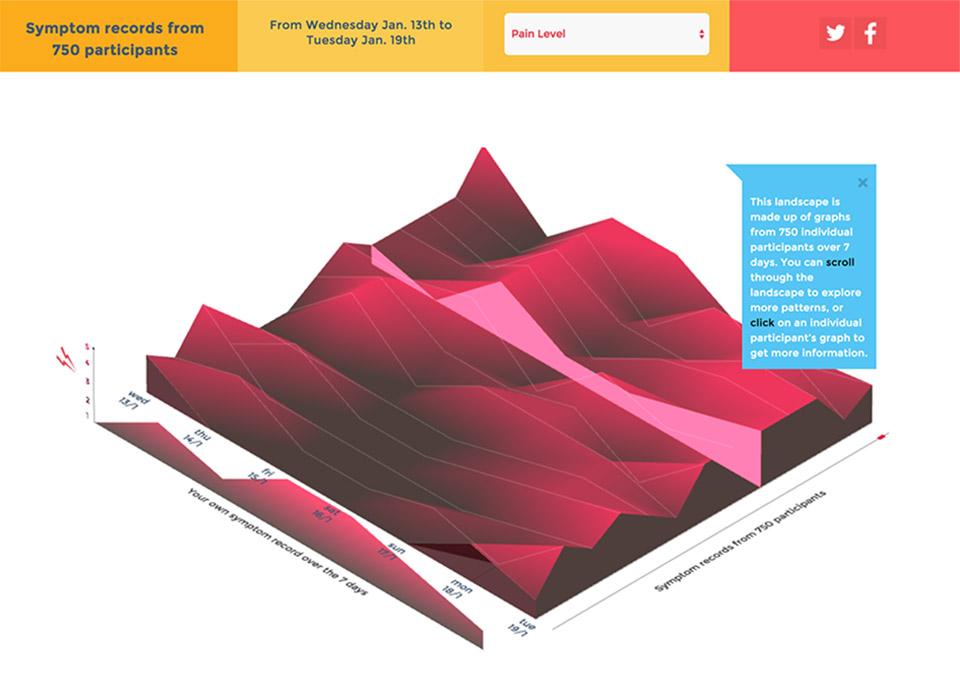
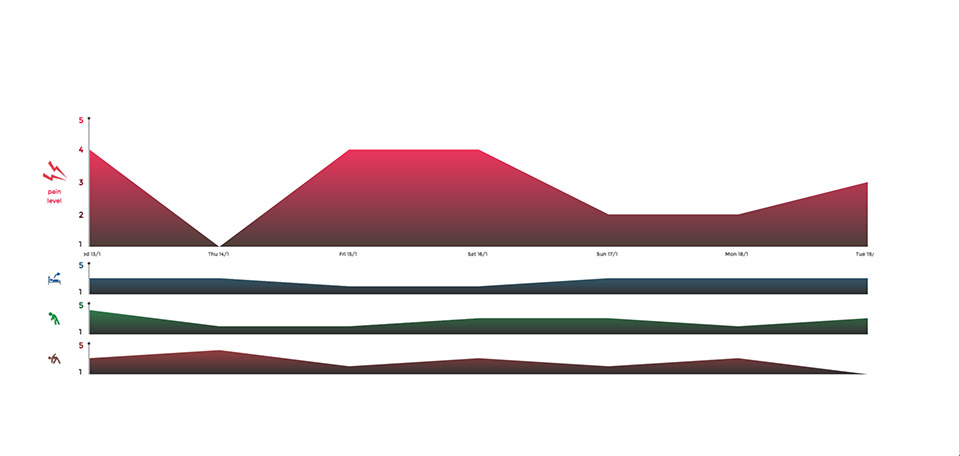
OCR created a simple interface where participants can visualize their own symptoms and compare them to the rest of the participants. On this graph, the 2D view gives you a week’s worth of symptoms recorded by a single participant. When switched to 3D mode, you can see how the personal records of hundreds of participants come together to create a scrollable landscape of pain symptoms.
To keep public engagement going, we also published multiple infographics exploring diverse aspects of the project. They asked questions such as: “What correlations can we find in this early data?” or, “Where are the cities where it has rained the most?” or “How consistently do people record their symptoms,” and so on. These small explorations really helped deepen our understanding of the data.
The “Citizen Science Project” lets everyone become part of the research team, by comparing symptom and weather records directly, creating their own hypotheses and submitting them to the university. Participants are first asked to compare their personal records and draw their own conclusions. After looking at their own records, they get to compare them to the rest of the participants. The most common hypotheses people submit will later on be analyzed by the research team at the University of Manchester.